About Me
Master’s
Computer Science
University of Houston
🎓 Bachelor's
Computer Science & Engineering
New Horizon College of Engineering
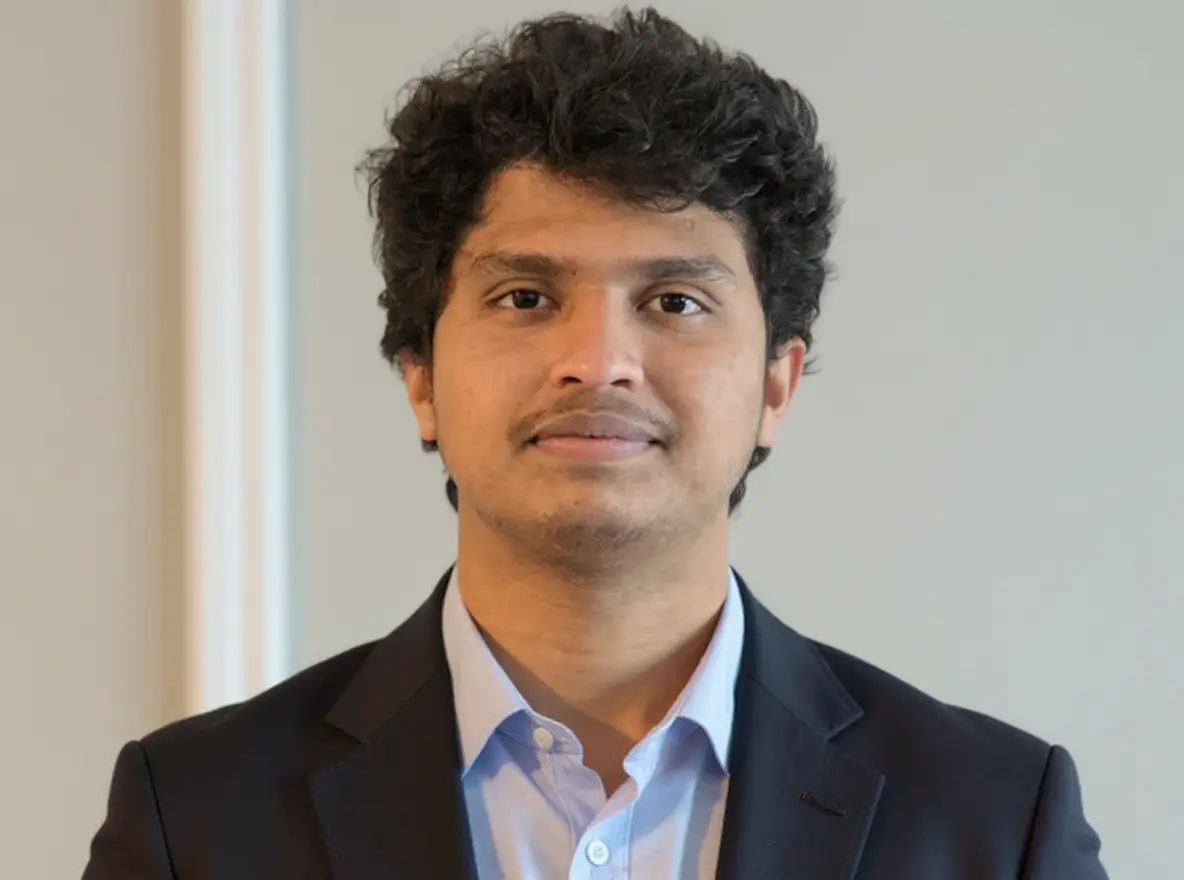
I'm Narasimha Royal, CS grad student at University of Houston, graduating May 2026.
I work with data. SQL, Python, Power BI, Tableau, AWS, that's my day-to-day. I clean messy datasets, build dashboards, and automate the boring stuff so people can make faster decisions.
I also teach Business Consulting and IT Project Management courses as a GTA, so I know how to explain technical work to people who don't care about the technical part, they just want the answer.
Looking for Spring 2026 internship or full-time roles in data analytics or data engineering.